Olabinjo,Oyebola Odunayo*Babatope, Okikiola Samuel, Ojo, Emmanuel Ohimai
Department of Agricultural and Environmental Engineering.
*Correspondence: Olabinjo, Oyebola Odunayo, Department of Agricultural and Environmental Engineering ,Federal University of Technology,Akure, Ondo State, Nigeria. Email: oyebolabinjo@gmail.com
Received: 08 Dec, 2025; Accepted: 24 Dec, 2025; Published: 01 Jan, 2026.
Citation: Olabinjo, Oyebola Odunayo, Babatope, Okikiola Samuel, Ojo, Emmanuel Ohimai. “Mathematical Modelling of the Drying kinetics of Fluted Pumpkin (Telfairia Occidentalis) Seeds Under Open Sun and Oven Drying Methods” J Nutr Diet Manage (2026):117. DOI: 10.59462/JNDM.4.1.117
Copyright: © 2026 Oyebola Olabinjo. This is an open-access article distributed under the terms of the Creative Commons Attribution License, which permits unrestricted use, distribution, and reproduction in any medium, provided the original author and source are credited.
Abstract
Biological materials including food crops are prone to deterioration and spoilage as a result of microbial reactions and being a living organism. Drying as an old techniques and reliable means of preservation has been adopted in reducing post-harvest loss and amnestying the scare food resources to meet the demand of food crops. Pumpkin seed is a nutritional indigenous seed known for its health, functional food properties and medicinal values. Moisture characteristics and drying time were used to evaluate the drying kinetics of Pumpkin seed. In this research, the thin layer drying performance of Fluted pumpkin (Telfairia occidentalis) seeds under two diverse drying techniques; open sun and oven drying strategies at temperature of 40o c, 50o c, 65o c, 60o c and 70o c were assessed so as to determined the best equation for the drying kinetics from thirteen (13) existing drying Mathematical models. The modified Page model showed the best statistical parameters for drying conditions of 65°C, 60°C and 50°C; Page model and Modified Henderson and Pabis model had the best goodness of fit for the drying process of pumpkin seeds dried at 70 °C and 40 °C respectively. From the validation, the results obtained established a good relationship between the experimental and predicted data, and indicated that all the models highlighted above for the selected drying methods are valid and can correctly predict its drying kinetics. Results also proved that as drying time reduced, the effective moisture diffusivity increased.
Keywords
Fluke Pumpkin Seeds, Drying Kinetics, Drying Rate, Modelling and Thermal Diffusivity.
Introduction
Fruits and vegetables are highly perishable commodities that need to be preserved to increase shelf-life. Drying is the world oldest and most common method of food preservation; whose main purpose is to extend the shelf-life of foods by reducing the in-water activity which may support microbial growth and activity. The drying kinetics of the sample is then evaluated and studied in order to know the behaviour of the sample under the drying conditions, and to determine the most suitable conditions for drying the sample. Odiaka [1] reported that the fluted pumpkin is indigenous to south eastern Nigeria, also found in Angola, Sierra Le- one, and parts of East Africa in Uganda. Fluted pumpkin (Telfairia occidentalis) was named after an Irish botanist based in Mauritius, Charles Telfair. It has been said that fluted pumpkin is associated with healing ability in treating some diseases [2]. After the consumption of fruits, their seeds are often regarded as wastes. However, this research shows that the seeds of fruit is not only useful for planting but also for medicinal and food additives purposes to maintain the nutritional requirement in mammals. The term “fluted” refers to the shape of the female flowers which resemble a flute. It is also called fluted gourd and in Nigeria, the Igbo people call it Ugu, the Yoruba people use Aworoko, and in Cameroon it is referred to as Ekobon [3]. Fluted pumpkin leaf (Telfairia occidentalis) has several health benefits, the leaf is rich in minerals such as iron, phosphorus, magnesium, potassium, calcium and sodium as stated by [4]. Pumpkin seeds contain 13 % oil has a high content of iodine and unsaturated fatty acids when compared to palm oil. Fluted pumpkin seeds are rich Fluted pumpkin seeds are rich in fat (53 %), crude protein (27 %) and amino acids (93.7 %) as reported by Odiaka [1]. (53 %), crude protein (27 %) and amino acids (93.7 %) as reported by [1]. It is also rich in antioxidants and vitamins. The seeds are rich in iodine, carbohydrate, fat and vitamin A [5]. Research has shown that plant seeds contain anti-nutritional factors such as enzyme inhibitors, allergens, lectins, and other naturally occurring substances that may influence diet intake, digestibility, absorption and metabolic processes in animals and humans [6]. Due to the present growth of the world population, the fastest rate in history and the aggregate net population growth is increasing year by year, there is critical need for seeds to be properly treated and stored. Nigeria is the largest economy in Africa with a population of over 200 million persons [7]. With the increase in production of processed fruit products, the amount of fruit wastes generated is increasing enormously. Large amount of these wastes poses the problem of disposal without causing environmental pollution. These wastes can be effectively disposed by manufacturing useful byproducts from them. The seeds were dried and the drying kinetics are then modelled, which introduces mathematical equations. Models are scientific representation of actual phenomenon using visual or mathematical equations to simulate their behaviour under different conditions. The models developed have been used in calculations involving the design and construction of new drying systems, optimization of the drying process, and the description of the entire drying behavior. In order to analyze the drying behavior of fruits and vegetables it is important to study the kinetics model of each particular product.
Materials and Methods
Materials
The raw material used for the practical were seeds gotten from pumpkin gourds. Fresh pumpkin gourds were obtained from the Ilara-Mokin market, near Akure in Ondo State. They were cut open to remove the seeds which were then used for the experiment. 2.2 Drying Experiment The experiment was done in the Crop Processing Laboratory of the Department of Agricultural and Environmental Engineering, School of Engineering and Engineering Technology, Akure (FUTA), Ondo State, Nigeria. Drying was done under open sun and in a laboratory oven (DHG9053A) with a fixed velocity of 1.4 ms-1. The samples were weighed using a digital weighing scale (Golden Mettler 20002) with a precision of ± 0.01 g. The samples were dried under open sun and in the oven at five different temperatures 40°C, 50°C, 60°C, 65°C and 70°C respectively.
The dryer was adjusted to the selected temperature for about an hour before the start of experiment to achieve the steady state conditions. Weight loss of samples was measured at an hourly interval. The experiments were repeated in triplicate and the average moisture ratio at each value was used to draw drying curves.
Drying Kinetics
The drying rate of the samples were calculated using Equation 1; the moisture content values were converted to moisture ratio, a dimensionless variable using Equation 2 [8].
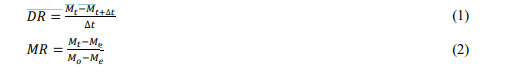
Where: DR is drying rate, Mt+Δt is moisture content at t+Δt, t it the time, Mt is moisture content at any time, MR is the moisture ratio and it is dimensionless, Mt is the moisture content at any time (kg water/kg dry solid), Me is the equilibrium moisture content (kg water/kg dry solid) and M0 is the initial moisture content (kg water/kg dry solid).
Statistical Analysis
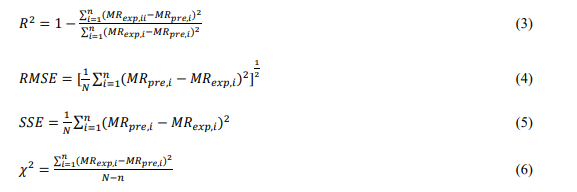
Thirteen thin layer drying models were used to evaluate the drying kinetics of the pumpkin seeds (table 1). The models were analysed with the one-way analysis of variance (ANOVA), and the non-linear regression tools of Microsoft Office Excel were used to select the best model. The statistical parameters used as the main determinant of the best model are coefficient of determination (R2), root mean square error (RMSE), sum of square error (SSE), and reduced chi-square (χ 2). [9,10].
| S/N | Models | Equation | References |
|---|---|---|---|
| 1 | Newton | MR = exp(-kt) | El-Beltagy et al.[7] |
| 2 | Page | MR = exp(-ktⁿ) | Ako.[18] |
| 3 | Modified page I | MR = exp[−(ktⁿ)] | Vega et al. [19] |
| 4 | Henderson and Pabis | MR = a exp (−ktⁿ) | Rosa et al. [13] |
| 5 | Modified Henderson and Pabis | MR = a exp (−kt) + b exp (−gt) + c exp (−ℎt) | Zenoozian et al. [20] |
| 6 | Midilli-Kucuk | MR = a exp (−kt)+ bt | Ayadi et al. [21] |
| 7 | Logarithmic | MR = a exp(−kt) + c | Kaur and Singh [22] |
| 8 | Two-term | MR = a exp(−k1t) + b exp (−k2t) | Sacilik [23] |
| 9 | Wang and Smith | MR = 1 + at + bt2 | Omolola et al. [24] |
| 10 | Hii et al | MR = a exp(−k1 tⁿ) + c exp (−gtⁿ) | Kumar et al |
| 11 | Diffusion Approach | MR = a exp(−kt) + (1 − a)exp (−kgt) | Yald´yz and Ertek´yn [25] |
| 12 | Two-term Exponential | MR = a exp(−kt) + (1 − a)exp (−kbt) | Yaldiz et al. [26] |
| 13 | Vermal et al. | MR = a exp(−kt) + (1 − a)exp(−gt) | Tzempelikos et al. [9] |
Table 1:Selected thirteen thin layer drying models used to evaluate the drying kinetics of the fluted pumpkin Seeds
Effective Moisture Diffusivity
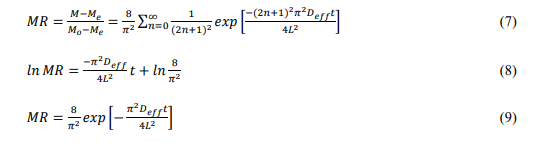
The effective moisture diffusivity which is the parameter that describes the mechanisms of moisture movement and is responsible for weight loss within the sample was estimated using Fick’s second diffusion model as given in the following equations;
Where:
8/π2 = the shape factor and depends on the geometry
of the drying material (4/π2 for a cylinder and 6/π2 for a
sphere),
Deff = the effective diffusivity (m²sˉ¹),
L = the half-thickness of the sample (m) n is a positive
integer,
MR = the moisture ratio,
t = the diffusion time
Activation Energy
As utilized by [10], Arrhenius equation was used to determine the activation energy. The correlation between the effective diffusivities and temperature is given by:
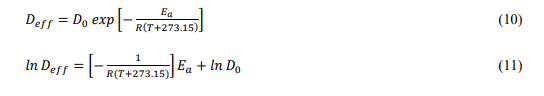
Where:
Do = the constant equivalent to the diffusivity at infinitely
high temperature (m2 min-1),
Ea = the activation energy (kJ/mol), R the universal gas
constant (8.314 x 10⁻³ kJ/mol).
T = the absolute temperature (K).
Result and Discussion
Moisture Content
The fresh pumpkin seeds had a high-water content of 39.431 %. The moisture content of the pumpkin seeds was reduced during drying at different temperature. The moisture content was brought to its lowest (10.326 %) when dried at 60 °C.
Drying Curves
It can be seen that the drying times of pumpkin seeds at temperatures of 70°C, 65°C, 60°C, 50°C, 40°C and for open sun drying were 18, 18, 20, 26 33 and 46 hours respectively (Figure 1). From Figure 1, the initial moisture content wet basis (39.431%) at the end of each drying temperature was found to be 10.14%, 10.34%, 10.56%, 10.81%, 11% and 12.79% for 70°C, 65°C, 60°C, 50°C, 40°C and open sun drying respectively. It was observed that at the beginning of the drying process the moisture movement decreased slowly, but at increased drying temperatures the moisture movement decreased rapidly until equilibrium moisture content was reached.
From the drying curves presented in Figure 1, 70 °C and 65 °C had the highest drying rate curve; while open sun drying had the lowest. From the graph presented, it was observed that the moisture content of the pumpkin seed decreased with every increase in temperature. It was also observed that the pumpkin seed experienced no constant rate period throughout the whole drying process; this means that the drying started at a moisture level below the critical moisture content and drying was controlled by diffusion. Similar observation was also made by [11,12] in the study of the drying of pumpkin seeds and [13] in the study of the drying of orange seeds. It can be observed from Figure 1 that the samples exhibited steady moisture removal.
Figure 1:Moisture content against drying time (hour) of pumpkin seeds at different drying temperature
In Figure 2, an increase of drying rate, given by the curve slope, with increase in temperature was observed, this is similar to the results of [13] for their orange seeds. The drying rate of the pumpkin seeds increased with every rise in temperature and consequently moisture ratio decreased at a faster rate. Rapid moisture removal occurred during the initial stage of drying, whereas it slowed down gradually in the next stages. For the two methods of drying, it can be observed that the initial moisture content of the pumpkin seeds is the critical moisture content since the sample did not undergo a constant drying rate before exhibiting a falling drying rate. At the end of the whole drying process, it was observed that the dehydration rates in the pumpkin seeds were dependent on the drying temperature.
The moisture content data obtained at each interval of drying were converted to moisture ratio. The moisture curves follow the same trend as the drying curves; showing that the higher temperatures, the greater the moisture loss. This trend is similar to the results of [11]. From the Figure 3, it can be observed that the 65°C and 70°C had the same curve. The sun-dried samples and 40°C oven dried samples had the sample moisture loss rate from the begin of the drying process until the ninth drying hour.
Figure 2:Drying rate versus drying time (hour) of pumpkin seeds at different drying temperature
Figure 3: Moisture ratio versus drying time (hour) of pumpkin seeds at different drying temperature
Effective Moisture Diffusivity
Figure 4 presents the variation of logarithm of moisture ratio against drying time at 40°C, 50°C, 60°C, 65°C and 70 °C drying air temperature and open sun drying. The coefficient of determination (R2) at 40°C, 50°C, 60°C, 65°C and 70 °C drying air temperature for the pumpkin seeds as determined from the graph were 0.9739, 0.9184, 0.9491, 0.9623, 0.9535 respectively and 0.9232 for open sun drying (Table 2). The effective moisture diffusivity calculated using Fick’s diffusion equation for 40°C, 50°C, 60°C, 65°C and 70 °C was estimated to be 7.611×10⁻⁷ m2 /s, 8.513×10⁻⁷, 1.260×10⁻⁶, 1.504×10⁻⁶ and 1.494×10⁻⁶ m2 /s respectively, and constant diffusivity (Do) was estimated as 0.004925 m2 /s. The results showed that the moisture diffusivity of the pumpkin seeds fall within the range of 10-9 to 10-12 m2 /s for agricultural crops [14] and also, it can be observed that reduced drying time increased the effective moisture diffusivity of the sample. The highest values of the effective moisture diffusivity of pumpkin seeds were recorded at 65 °C (1.504×10⁻⁶ m2 /s). The effective moisture diffusivity of the pumpkin seeds was found to be higher than Salak (salacca edulus) (1.11×10⁻¹¹ m2 /s) oven dried at 70 o c [15], aloe Vera (1.55×10⁻⁹ m2 /s) dried at 80 o c [14].
Figure 4:The change of In (MR) by time (seconds) of Pumpkin seed
| S/N | Temperature (°C) | Deff (m2 /s) | R2 |
|---|---|---|---|
| 1 | 40 | 7.611×10⁻⁷ | 0.9739 |
| 2 | 50 | 8.513×10⁻⁷ | 0.9184 |
| 3 | 60 | 1.260×10⁻⁶ | 0.9491 |
| 4 | 65 | 1.504×10⁻⁶ | 0.9623 |
| 5 | 70 | 1.494×10⁻⁶ | 0.9535 |
Table 2:Estimated Effective Moisture Diffusivity of pumpkin seeds
Activation Energy
The activation energy of the pumpkin seeds was determined using the Arrhenius Equation and by plotting a graph of the antilogarithm of effective moisture diffusivity (lnDeff) against the reciprocal of the absolute temperature (Figure 5). The activation energy of the samples was estimated as 22.97 kJ/mol. This was found to be lower than those of salak (salacca edulus) (45.27 kJ/mol) and tomato (33.33 kJ/mol – 43.23 kJ/mol) in the research of [15,16] respectively.
Figure 5:Antilogarithm of EMD against reciprocal of temperature
Modelling
The drying data gotten from the drying of pumpkin seeds in the open sun and oven at varying drying temperatures (70°C, 65°C, 60°C, 50°C and 40°C) were fitted into the thirteen of the existing thin-layer drying models. The model with the highest value for coefficient of determination (R²), lowest value for root-mean square error (RMSE), lowest value for chi-square (χ²) and lowest value for sum of square error (SSE) is ranked as the best model for predicting the drying kinetics of pumpkin seeds as shown in table 3. Due to higher values of R2 (0.9331), lower values of SSE (1.4826), RMSE (0.1776) and χ² (0.0345), the two-term model was chosen to represent the drying process of pumpkin seeds for open sun drying. The modified Page model showed the best statistical parameters for drying conditions of 65°C, 60°C and 50°C with R2 values of 0.9963, 0.9962 and 0.9706 respectively; SSE values of 0.0128, 0.0209 and 0.0327 respectively; RMSE values of 0.0260, 0.0315 and 0.0348 respectively and χ² values of 0.0008, 0.0012 and 0.0014 respectively. The Page model and Modified Henderson and Pabis model had the best goodness of fit for the drying process of pumpkin seeds dried at 70°C and 40°C respectively. This is in line with the result of [12] for their oven dried pumpkin seeds, and [11] for their fluidized bed dried pumpkin seed. The Page model had values for R 2, SSE, RMSE and χ² to be 0.9920, 0.0249, 0.0362 and 0.0015 respectively; while the Modified Henderson and Pabis model had values for R 2, SSE, RMSE and χ² to be 0.9756, 0.0725, 0.0462 and 0.0023 respectively.
| Drying term | Model constant | R² | RMSE | X² | SSE | |
|---|---|---|---|---|---|---|
| Open | Newton | k = 0.048 | 0.9000 | 0.2157 | 0.0475 | 2.1868 |
| Page | k = 0.098; n = 0.773 | 0.9012 | 0.2107 | 0.0464 | 2.0868 | |
| Henderson and Pabis | k = 0.046; a = 1.091 | 0.9211 | 0.2001 | 0.0418 | 1.8820 | |
| Logarithmic | k = 0.137; a = 0.066; c = 0.053 | 0.9080 | 0.4943 | 0.2610 | 11.4841 | |
| Two Term | k = -0.07; a = 0; c = 1.078; g = 0.016 | 0.9331 | 0.1776 | 0.0345 | 1.4826 | |
| Two Term Exponential | k = 0.435; a = -0.003; b = -15.041 | 0.9009 | 0.2328 | 0.0579 | 2.5468 | |
| Verma et al. | k = 0.504; a = -0.007; g = 0.081 | 0.9018 | 0.3535 | 0.1348 | 5.1231 | |
| Diffusion approach | k = 0.069; a = 1.1; g = 1 | 0.9116 | 0.3160 | 0.1077 | 4.0930 | |
| Midilli-Kucuk | k = 0.019; a = 1.297; n = 1.065; b = 0.003 | 0.9153 | 0.3001 | 0.0947 | 3.6920 | |
| Wang and smith | a = -0.065; b = 0.92 | 0.9013 | 1.1387 | 1.3630 | 53.1580 | |
| Hi et al. | k = 0.026; a = 1.21; g = 0.628; n = 0.921; c = 0.949 | 0.9013 | 0.3301 | 0.1176 | 4.4687 | |
| Modified page | k = 0.164; a = 1.076; n = 0.79 | 0.9011 | 0.3628 | 0.1420 | 5.3956 | |
| Modified Henderson and Pabis | k = 0.057; a = 0.784; g = 4.104; b = 0.055; c = 0.117 | 0.9264 | 0.2855 | 0.0879 | 3.3410 | |
| 40 | Newton | k = 0.122 | 0.9004 | 0.3289 | 0.1115 | 3.6783 |
| Page | k = 0.149; n = 0.857 | 0.9229 | 0.2854 | 0.0866 | 2.7700 | |
| Henderson and Pabis | k = 0.116; a = 1.081 | 0.9093 | 0.3244 | 0.1118 | 3.5789 | |
| Logarithmic | k = 0.109; a = 0.049; c = 0.045 | 0.9095 | 0.5111 | 0.2865 | 8.8812 | |
| Two Term | k = -0.011; a = 0.012; c = 0.035; g = 0.025 | 0.9770 | 0.5575 | 0.3522 | 10.5659 | |
| Two Term Exponential | k = 0.469; a = -0.028; b = -2.361 | 0.9685 | 0.1753 | 0.0337 | 1.0444 | |
| Verma et al. | k = 0.649; a = -0.032; g = 0.111 | 0.9197 | 0.3139 | 0.1081 | 3.3511 | |
| Diffussion approach | k = 0.084, a = 1.58, g = 1.95 | 0.9665 | 0.1608 | 0.0284 | 0.8793 | |
| Midili-Kucuk | k = 0.019, a = 0.995, n = 1.223, b = 0.004 | 0.9675 | 0.1036 | 0.0114 | 0.3648 | |
| Wang and smith | a = -0.025, b = 0.92 | 0.9581 | 0.0729 | 0.0057 | 0.1808 | |
| Hii et al. | k = 0.002, a = 1.399, g = 0.202, n = 1.549, c = 0.852 | 0.9169 | 0.6796 | 0.5066 | 15.7049 | |
| Modified page | k = 0.202, a = 1.007, n = 0.502 | 0.9321 | 0.0937 | 0.0096 | 0.2987 | |
| Modified Henderson and Pabis | k = 0.042, a = 0.91, g = 2.596, b = -0.016, c = 0.079 | 0.9756 | 0.0462 | 0.0023 | 0.0725 | |
| 50 | Newton | k = 0.105 | 0.9157 | 0.1692 | 0.0297 | 0.7731 |
| Page | k = 0.202; n = 0.807 | 0.9466 | 0.1949 | 0.0410 | 1.0255 | |
| Henderson and Pabis | k = 0.156; a = 1.081 | 0.9208 | 0.2559 | 0.0707 | 1.7681 | |
| Logrithmic | k = 0.162, a = 0.05, C = 0.03 | 0.9017 | 0.4095 | 0.1886 | 4.5272 | |
| Two Term | k = -0.023, a = 0.008, c = 0.031, g = 0.078 | 0.9033 | 0.4681 | 0.2573 | 5.9168 | |
| Two Term Exponential | k = 0.394, a = -0.062, b = -2.379 | 0.9168 | 0.2444 | 0.0672 | 1.6124 | |
| Verma et al. | k = 0.359, a = 0.048, g = 0.115 | 0.9229 | 0.1890 | 0.0402 | 0.9640 | |
| Diffussion approach | k = 0.1, a = 1.028, g = 3.286 | 0.9103 | 0.1570 | 0.0277 | 0.6659 | |
| Midili-Kucuk | k = 0.079, a = 0.966, n = 1.092, b = 0.001 | 0.9001 | 0.1532 | 0.0254 | 0.6340 | |
| Wang and smith | a = -0.092, b = 0.92 | 0.8126 | 0.8775 | 0.8315 | 20.7887 | |
| Hii et al. | k = 0.009, a = 1.693, g = 1.297, n = 1.543, c = 0.858 | 0.9517 | 0.7415 | 0.6186 | 14.8470 | |
| Modified page | k = 0.21, a = 1.011, n = 0.557 | 0.9706 | 0.0348 | 0.0014 | 0.0327 | |
| Modified Henderson and Pabis | k = 0.028, a = 0.599, g = 2.651, b = 0.096, c = 0.079 | 0.9377 | 0.0538 | 0.0033 | 0.0780 | |
| 60 | Newton | k = 0.141 | 0.9747 | 0.1491 | 0.0233 | 0.4669 |
| Page | k = 0.086; n = 0.556 | 0.9800 | 0.3128 | 0.1082 | 2.0553 | |
| Henderson and Pabis | k = 0.156; a = 1.081 | 0.9783 | 0.1819 | 0.0366 | 0.6947 | |
| Logrithmic | k = 0.306, a = 0.064, C = 0.078 | 0.9035 | 0.3554 | 0.1473 | 2.6520 | |
| Two Term | k = -0.012, a = 0.001, c = 0.096, g = 0.083 | 0.9411 | 0.4407 | 0.2400 | 4.0792 | |
| Two Term Exponential | k = 0.269, a = -0.058, b = -2.661 | 0.9759 | 0.1800 | 0.0378 | 0.6807 | |
| Verma et al. | k = 0.44, a = 0.013, g = 0.122 | 0.9690 | 0.1192 | 0.0166 | 0.2986 | |
| Diffussion approach | k = 0.18, a = 1.266, g = 3.344 | 0.9585 | 0.1769 | 0.0365 | 0.6574 | |
| Midili-Kucuk | k = 0.046, a = 0.993, n = 0.996, b = 0.002 | 0.9040 | 0.2234 | 0.0551 | 1.0476 | |
| Wang and smith | a = -0.057, b = 0.92 | 0.8317 | 0.1919 | 0.0407 | 0.7734 | |
| Hii et al. | k = 0.048, a = 1.142, g = 0.536, n = 0.861, c = 0.955 | 0.9869 | 0.5294 | 0.3270 | 5.8865 | |
| Modified page | k = 0.231, a = 1.004, n = 0.635 | 0.9962 | 0.0315 | 0.0012 | 0.0209 | |
| Modified Henderson and Pabis | k = 0.03, a = 0.999, g = 2.648, b = 0.089, c = 0.08 | 0.9380 | 0.3414 | 0.1360 | 2.4477 | |
| 65 | Newton | k = 0.123 | 0.9777 | 0.0941 | 0.0094 | 0.1684 |
| Page | k = 0.266; n = 0.618 | 0.9947 | 0.0491 | 0.0027 | 0.0458 | |
| Henderson and Pabis | k = 0.156; a = 1.081 | 0.9857 | 0.1616 | 0.0292 | 0.4962 | |
| Logrithmic | k = 0.212, a = 0.018, C = 0.072 | 0.9713 | 0.3816 | 0.1729 | 2.7663 | |
| Two Term | k = 1.014, a = 0.017, c = 1.443, g = 0.013 | 0.9004 | 0.8323 | 0.8774 | 13.1617 | |
| Two Term Exponential | k = 0.42, a = -0.01, b = -12.485 | 0.9780 | 0.1004 | 0.0120 | 0.1914 | |
| Verma et al. | k = 0.453, a = 0.003, g = 0.112 | 0.9737 | 0.0782 | 0.0073 | 0.1162 | |
| Diffussion approach | k = 0.032, a = 1.097, g = 1 | 0.9053 | 0.3041 | 0.1098 | 1.7568 | |
| Midili-Kucuk | k = 0.075, a = 0.999, n = 0.795, b = 0.006 | 0.9756 | 0.2770 | 0.0858 | 1.4581 | |
| Wang and smith | a = -0.11, b = 0.92 | 0.8617 | 0.6212 | 0.4313 | 7.3316 | |
| Hii et al. | k = 0.087, a = 1.876, g = 1.371, n = 0.979, c = 0.95 | 0.9840 | 0.7019 | 0.5850 | 9.3599 | |
| Modified page | k = 0.22, a = 1.034, n = 0.629 | 0.9963 | 0.0260 | 0.0008 | 0.0128 | |
| Modified Henderson and Pabis | k = 0.049, a = 0.855, g = 3.262, b = 0.03, c = 0.093 | 0.9386 | 0.1831 | 0.0398 | 0.6368 | |
| 70 | Newton | k = 0.117 | 0.9697 | 0.0838 | 0.0074 | 0.1333 |
| Page | k = 0.301; n = 0.548 | 0.9920 | 0.0362 | 0.0015 | 0.0249 | |
| Henderson and Pabis | k = 0.156; a = 1.081 | 0.9831 | 0.1551 | 0.0269 | 0.4573 | |
| Logrithmic | k = 0.325, a = 0.09, C = 0.058 | 0.9061 | 0.3671 | 0.1601 | 2.5610 | |
| Two Term | k = -0.012, a = 0, c = 1.768, g = 0.07 | 0.9357 | 0.5858 | 0.4347 | 6.5199 | |
| Two Term Exponential | k = 0.162, a = -0.03, b = -3.307 | 0.9587 | 0.0602 | 0.0043 | 0.0690 | |
| Verma et al. | k = 0.775, a = 0.01, g = 0.124 | 0.9746 | 0.0938 | 0.0104 | 0.1671 | |
| Diffussion approach | k = 0.149, a = 1.2, g = 1.1 | 0.9809 | 0.1286 | 0.0196 | 0.3142 | |
| Midili-Kucuk | k = 0.061, a = 0.983, n = 0.781, b = 0.004 | 0.9597 | 0.3131 | 0.1096 | 1.8630 | |
| Wang and smith | a = -0.089, b = 0.92 | 0.8467 | 0.4141 | 0.1917 | 3.2584 | |
| Hii et al. | k = 0.078, a = 1.403, g = 0.822, n = 0.975, c = 0.989 | 0.9835 | 0.5191 | 0.3199 | 5.1190 | |
| Modified page | k = 0.214, a = 1.053, n = 0.779 | 0.9939 | 0.0795 | 0.0075 | 0.1201 | |
| Modified Henderson and Pabis | k = 0.141, a = 0.93, g = 2.089, b = 0.018, c = 0.054 | 0.9819 | 0.0957 | 0.0109 | 0.1742 |
Table 3: Values of drying constants and coefficients of mathematical models for the drying of fluted pumpkin seeds under open
Validation of Models Used
The correlation between the predicted data and the experimented data of the best models for open sun drying and oven drying at varying temperatures. It can be observed that under all drying temperatures, the values of the coefficient of determination (R2) were greater than 0.75, which is a satisfactory representation of the drying process, according to [13]. The R2 values from the square graphs for the open sun drying, 70°C, 65°C, 60°C, 50°C and 40°C is 0.9331, 0.992, 0.9963, 0.9962, 0.9706 and 0.9756 respectively. This indicates a good fit; and that all the models derived for drying of pumpkin seeds under the selected drying methods are valid and can correctly predict its drying kinetics.
Conclusions
The modified Page model showed the best statistical parameters for drying conditions of 65°C, 60°C and 50°C with R2 values of 0.9963, 0.9962 and 0.9706 respectively; SSE values of 0.0128, 0.0209 and 0.0327 respectively; RMSE values of 0.0260, 0.0315 and 0.0348 respectively and χ² values of 0.0008, 0.0012 and 0.0014 respectively. The Page model and Modified Henderson and Pabis model had the best goodness of fit for the drying process of pumpkin seeds dried at 70 °C and 40 °C respectively. The Page model had values for R 2, SSE, RMSE and χ² to be 0.9920, 0.0249, 0.0362 and 0.0015 respectively; while the Modified Henderson and Pabis model had values for R 2, SSE, RMSE and χ² to be 0.9756, 0.0725, 0.0462 and 0.0023 respectively. From the validation, the results obtained established a good relationship between the experimental and predicted data, and indicated that all the models highlighted above for the selected drying methods are valid and can correctly predict its drying kinetics. Results also proved that as drying time reduced, the effective moisture diffusivity increased.
Source of Funding
This research did not receive any specific grant from any funding agency in the public, commercial or not- for- profit sector.
Declaration of Competing Interest
The authors declare that they have no conflict of interest.
References