Isha Mukherjee¹*, Dr. Shambhavi G²
1Bengaluru North University, 1Montfort College, Bengaluru
2Assistant Professor, Montfort College, Bengaluru North University, Bengaluru
*Correspondence: Isha Mukherjee, Montfort College, Bengaluru North University, Bengaluru, Bengaluru, India. E-mail: isha.mukherjee07@gmail.com
Received: 07 Nov, 2025; Accepted: 26 Dec, 2025; Published: 29 Dec, 2025.
Citation: Isha Mukherjee & Dr. Shambhavi G. “The Impact of Doom scrolling on Emotional Desensitization in Generation Z.” J. Mental Health Behav. Sci (2025):106. DOI: 10.59462/JMHBS.1.1.106
Copyright: © 2025 Isha Mukherjee. This is an open-access article distributed under the terms of the Creative Commons Attribution License, which permits unrestricted use, distribu tion, and reproduction in any medium, provided the original author and source are credited.
Abstract
Background: The rise of digital technology has transformed how young people interact with media, leading to increased exposure to online content. Among Generation Z, doomscrolling, compulsive engagement with negative news or distressing social media content has become prevalent, raising concerns about potential psychological consequences, particularly emotional desensitization.
Aims: This study aims to examine whether the frequency of doomscrolling is a significant predictor of emotional desensitization in Generation Z. The research seeks to clarify whether doomscrolling independently affects emotional responsiveness, or if other factors may play a mediating role.
Methods: A cross-sectional, quantitative survey design was employed. Ninety-four participants, aged 13–28 and active on at least two social media platforms, were purposively recruited. Respondents completed the Doomscrolling Scale to measure negative content consumption habits and the Perth Emotional Reactivity Scale–Short Form to assess positive and negative emotional reactivity. Data were analysed using correlational and regression analyses to evaluate the predictive relationship, with ethical standards upheld via informed consent and data anonymisation.
Results: Participants reported moderate levels of doomscrolling and emotional responsiveness. Statistical analyses revealed weak, non-significant associations between doomscrolling frequency and both positive and negative emotional reactivity. Regression analysis showed that doomscrolling explained minimal variance in emotional responsiveness, indicating no substantial predictive effect.
Conclusions: Doomscrolling was not found to be a significant predictor of emotional desensitization among Generation Z in this sample. The findings suggest emotional numbing is likely influenced by multiple factors beyond doomscrolling alone. Further research should investigate potential mediators and
Research Article
explore longitudinal patterns to better understand the psychological effects of digital media consumption.
Keywords
Doomscrolling, emotional desensitization, Generation Z, regression analysis, digital media.
Introduction
The digital landscape has profoundly shaped human inter action, with Generation Z, those born between 1997 and 2012, emerging as the first cohort to be fully immersed in online environments [1]. Their daily routines, education, socialization, and leisure are mediated by smartphones, algorithm-driven platforms, and 24/7 connectivity. While such immersion offers opportunities for learning and so cial connection, it also entails unprecedented exposure to crises, including climate change, political instability, mass violence, and economic uncertainty.
One behaviour that exemplifies this shift is doomscroll ing, defined as the compulsive consumption of negative news and online content. Doomscrolling surged into public awareness during the COVID-19 pandemic and has since persisted as a cultural phenomenon. For Gen Z, whose average daily screen time exceeds 4.5 hours on social media platforms [2], doomscrolling represents more than a fleeting habit, it is a patterned way of engaging with global events.Prior research has linked doomscrolling to stress, anxiety, depressive symptoms, and “digital fatigue” [3]. Beyond im mediate distress, however, scholars have raised concerns that repeated exposure to negative content fosters emo tional desensitization-a dampening of emotional respon siveness to distressing stimuli. While desensitization has been examined in contexts such as violent video games and trauma exposure [4], its role in digital news consump tion remains underexplored.
Theoretically, doomscrolling’s effects can be understood through multiple frameworks. Cultivation theory suggests that sustained media exposure shapes perceptions of re ality, often leading to apathy or cynicism [5]. Negativity bias explains the human tendency to prioritize negative information [6], a tendency amplified by algorithms that re ward emotionally charged content. Habituation theory pos its that repeated exposure reduces responsiveness over time [7]. These frameworks together suggest that doom scrolling may foster emotional detachment, yet empirical evidence remains scarce.
This study addresses that gap by quantitatively examining whether doomscrolling predicts emotional desensitization among Gen Z. Using validated instruments and regression analysis, it investigates whether compulsive digital engagement with negative news correlates with diminished positive or negative reactivity. Findings contribute to a growing body of work on the psychological implications of digital immersion and provide insights into safeguarding emotional well-being in a hyperconnected era.
Review of Literature
Scholars have approached doomscrolling from emotional, cognitive, and behavioural perspectives. [8] conceptual ized it as an adaptive but problematic response to digital distress, where initial strong emotions give way to numb ness and detachment. Similarly, [9] emphasized doom scrolling during crises as driven by an illusion of control, ultimately leading to emotional paralysis rather than pre paredness.Cognitive factors play a central role. [10] identified fear of missing out (FOMO) and negativity bias as primary drivers among Gen Z. Participants compulsively checked feeds to stay updated, while algorithms amplified negative content, reinforcing cycles of overexposure and emotional fatigue. [11] found that Indian students transitioned from compassion to humor and emotional dullness when faced with recurring digital suffering, using memes to create psycho logical distance.
Empirical studies further support links between doom scrolling and emotional blunting. [3,12] described how constant pandemic-related exposure led to emotional withdrawal and “pandemic fatigue,” reducing empathy and compliance with health measures. [13] highlighted algo rithmic structures that trap users in cycles of emotionally charged content, while [14] distinguished between active and passive media use: passive scrollers experienced greater empathy decline.
Coping mechanisms also shape responses. Humor and irony, as noted by [11,15] provided relief but risked reinforc ing detachment. Physiological evidence supports psycho logical findings: [16] reported that frequent doomscrollers exhibited reduced autonomic responses to distressing stimuli, suggesting embodied desensitization. [15] found that humor helps buffer emotional distress. Doomscrolling is significantly linked to psychological distress, negative affect, and emotional fatigue [16].
Personality differences moderate these outcomes. [17] demonstrated that individuals high in neuroticism or impul sivity were more prone to detachment after digital trauma, while research on compassion fatigue suggests that emotionally sensitive individuals may initially show heightened empathy but later experience emotional ex haustion and burnout following repeated exposure to distressing content [18]. [19,20] further link excessive en gagement with negative online material to cynicism and compassion fatigue, particularly within online activism. Critically, recent scholars have emphasized the importance of quantitatively examining the emotional consequences of excessive negative content consumption, advocating regression- based approaches linking digital engagement to psychological distress and emotional responsiveness [16,21]. This methodological emphasis informs the present study, which directly tests whether doomscrolling frequen cy predicts emotional reactivity using validated scales. Collectively, the literature suggests that doomscrolling con tributes to emotional strain and detachment but highlights the importance of quantifying these effects. The present research builds on this foundation by employing a regres-sion model to assess the predictive relationship between doomscrolling and emotional desensitization in Gen Z.
Methodology
Research problem
While the effects of doomscrolling on mental health im pacts such as anxiety and depression have been docu mented [3], its direct relationship with emotional desensiti zation, particularly assessed through a regression analysis in Gen Z populations - remains underexplored.
Framework
A quantitative, correlational design was employed, utilizing simple linear regression to test whether doomscrolling fre quency predicts emotional desensitization. The study was informed by Desensitization Theory [22] and Uses and Gratification Theory [23].
Research design
Quantitative Studies: Correlational
This study will employ a quantitative, correlational research design, to examine the relationship between Doomscroll ing frequency and Emotional Desensitization. Specifically, simple linear regression analysis was used to determine the predictive relationship of doomscrolling on emotional desensitization. This design is appropriate for identifying the strength and direction of the continuous independent variable which predicts the outcome of the continuous de pendent variable.
Research aim and objectives
Aim: To examine the relationship between doomscrolling frequency and emotional desensitization among Gen Z in dividuals.
Objectives:
• To measure the doomscrolling frequency and behavior in Gen Z participants.
• To assess the levels of emotional desensitization in Gen Z individuals.
• To analyze the relationship between doomscrolling frequency and emotional desensitization through re gression analysis.
Research questions:
1. Does the frequency of doomscrolling significantly pre dict emotional desensitization in Generation Z? 2. Are there differences in emotional desensitization lev els between high and low doomscrollers in Gen Z? 3. Does the frequency of doomscrolling correlate with re duced emotional reactivity in Gen Z?
Variables and operational definationsIndependent variable
Doomscrolling- the compulsive consumption of negative content online [24]. (frequency, duration or intensity of Doomscrolling)
Dependent variable
Emotional Desensitization- reduced emotional respon siveness to negative stimuli after repeated exposure as a form of habituation [25]. (emotional reactivity or intensity).
Hypotheses
H01: The doomscrolling frequency does not significantly predict the impact of emotional desensitization in Genzer ation Z.
H02: There is no significant difference in emotional de sensitization levels between high and low doomscrollers in Gen Z.
H03: There is no correlation between the frequency of doomscrolling and reduced emotional reactivity in Gen Z.
Population and Sampling
Demographic Profile: Participants aged 13-28 years (1997-2012) Gen Z [1], active on at least two social media platforms.
Sample Size: 101 participants
Sampling Technique: Purposive sampling through online recruitment on platforms such as Instagram and Reddit/ Twitter/Facebook.
Data collection methods
Measures & Materials
Doomscrolling Scale (DSS):
This scale was developed by [10]. It comprises of 15 items (e.g., “I lose track of time when I read bad news on social media”) rated on a 7-point Likert scale, with 1 indicating “strongly disagree” and 7 indicating “strongly agree. “High scores imply high doomscrolling frequency. Researchers supported the validity and reliability of the scale with different parameters.
The Doomscrolling Scale by [10] shows excellent reliabili ty, with Cronbach’s alpha ranging from 0.938 to 0.944. Its construct validity was confirmed through CFA (CFI = 0.92, SRMR = 0.046), and it demonstrated strong item discrimi nation (IRT values between 1.69 and 3.31). The scale also showed convergent validity through significant correlations with depression, anxiety, and smartphone addiction.
Perth Emotional Reactivity Scale (PERS-S): The Perth Emotional Reactivity Scale-Short Form (PERS-S) is an 18-item short form of the 30-item PERS. The PERS-S is designed to measure trait levels of emo tional reactivity. It measures the typical ease of activation, intensity, and duration of one’s emotional responses, and do so for negative and positive emotions separately. The PERS-S [26] shows good reliability, with Cronbach’s alpha ranging from .76 to .89, and composite alphas of .83 (positive) and .90 (negative reactivity). Test–retest re liability ranges from .79 to .89. CFA confirms a valid factor structure, and the scale shows concurrent validity through strong correlations with emotion regulation, affect, and dis tress measures.
Inclusion and Exclusion criteria:
Inclusion Criteria: Individuals aged 13-28, active social media users, fluent in English.
Exclusion Criteria: Individuals with self-reported clinical diagnoses that impair emotional regulation (e.g., major de pressive disorder).
Delimitations
The study will be geographically limited to urban popula tions and will utilize self-report measures only. Only Gen Z individuals with regular social media use will be included. Gen Z individuals who are active at least on two social media platforms.
Procedure and Ethics
Participants completed online questionnaires after provid ing informed consent. Confidentiality and anonymity were
maintained in line with APA ethical standards. No manipu lation was involved, and withdrawal was permitted at any stage.
Results
A total of 94 participants were eligible for the study, with a mean age of 23. The sample consisted of 56.5 % females (N = 56) and 43.5 % males (N = 43).
|
Variable |
Mean |
SD |
Minimum |
Maximum |
|
DSS |
34.9 |
15.5 |
15.0 |
71.0 |
|
PERS-S (positive) |
33.8 |
6.23 |
18.0 |
45.0 |
|
PERS-S (negative) |
31.1 |
6.89 |
15.0 |
45.0 |
|
Note. DSS= Doomscrolling scale, PERS-S= Perth Emotional Reactivity Scale-Short, SD= Standard Deviation |
||||
Table 1: Descriptive statistics for DSS and PERS-S (positive and negative reactivity)
Table 1 presents the descriptive statistics for the Doom scrolling Scale (DSS) and the Perth Emotional Reactivity Scale- Short (PERS-S), covering both positive and neg ative emotional reactivity. The mean score on the DSS was 34.9 with a standard deviation of 15.5, indicating a moderate level of doomscrolling behavior among partici pants, with variability scores ranged from 15.0 to 71.0. For emotional reactivity, the mean score for positive reactiv ity was 33.8 (SD = 6.23), while negative reactivity had a mean of 31.1 (SD = 6.89). The score ranges for both sub scales were between 15.0 to 45.0, showing moderate lev els of emotional response with relatively lower variability compared to doomscrolling. Overall, the findings suggest that while participants reported moderate engagement in doomscrolling, they also exhibited moderate to high emo tional reactivity, with slightly greater intensity in positive reactivity. The broader spread in DSS scores indicates in dividual differences in online media consumption behavior within the sample.
|
Variable |
Range |
IQR |
Skewness |
Kurtosis |
||
|
DSS |
56.0 |
25.3 |
0.604 |
-0.703 |
||
|
PERS-S (positive) |
27.0 |
8.00 |
-0.404 |
-0.0529 |
||
|
PERS-S (negative) |
30.0 |
9.00 |
0.0738 |
0.428 |
||
|
|---|
Table 2: Range, Interquartile Range, Skewness, and Kurtosis of scores obtained on DSS and PERS-S (positive and negative reactivity)
Table 2 shows scores on the Doomscrolling Scale (DSS) and the Perth Emotional Reactivity Scale- Short (PERS-S) for both positive and negative reactivity. The DSS scores showed the highest range (56.0) and interquartile range (25.3), indicating greater variability in doomscrolling behavior among participants. The skewness value of 0.604 suggests a moderate positive skew, meaning that a larger number of participants reported lower levels of doomscroll ing, with fewer scoring high. The negative kurtosis value (-0.703) indicates a relatively flat distribution compared to a normal curve. In contrast, the PERS-S positive reactiv ity scores had a lower range (27.0) and IQR (8.00), with a skewness of -0.404 indicating a slight negative skew, meaning more participants scored higher on positive reac tivity. Its kurtosis value (-0.0529) is close to zero, reflecting a near-normal distribution. The PERS-S negative reactiv ity scores showed a range of 30.0 and IQR of 9.00, with minimal skewness (0.0738), indicating a near-symmetrical distribution. The kurtosis of -0.428 suggests a slightly flat ter distribution than normal. Overall, doomscrolling scores showed greater variability and a more uneven distribution, while emotional reactivity scores, both positive and neg ative, were more consistent and approximately normally distributed.
|
Variable |
Statistics |
p |
|
DSS |
0.925 |
.001* |
|
PERS-S (positive) |
0.975 |
0.067 |
|
PERS-S (negative) |
0.986 |
0.402 |
|
|
|
|
| Note. *p<0.05 | ||
|---|---|---|
Table 3: Normality tests (Kolmogorov- Smirnov) of Doomscroll ing Scale and Perth Emotional Reactivity Scale
Table 3 shows the results of the Kolmogorov-Smirnov test used to assess the normality of the data for the Doom scrolling Scale (DSS) and the Perth Emotional Reactivity Scale- Short (PERS-S), including both positive and neg ative emotional reactivity. The result for the DSS shows a statistically significant p-value (< .001), indicating that the data for doomscrolling does not follow a normal distri bution. In contrast, the PERS-S positive reactivity scores have a p- value of 0.067, which is greater than the 0.05, suggesting that the data is approximately normally dis tributed. Similarly, the PERS-S negative reactivity scores have a p-value of 0.402, also indicating a normal distri bution. Therefore, while the emotional reactivity variables meet the assumption of normality, the doomscrolling vari able does not. This suggests that non- parametric statistical tests like Spearman’s correlation may be more appro priate for analyzing relationships involving the DSS.
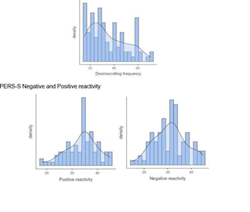
Figure 1: Histogram showing frequency distributions of Doomscrolling Scale and Perth Emotional Reactivity Scale-Short positive and negative reactivity
The histograms represent the distribution of scores for the Doomscrolling Scale (DSS) and the Perth Emotional Reactivity Scale-Short (PERS-S), including both positive and negative reactivity. The histogram for doomscrolling frequency shows a positively skewed distribution, with a greater concentration of participants scoring lower on doomscrolling and fewer individuals scoring at the higher end. The Kolmogorov- Smirnov data shows a significant deviation from normality for the DSS. In contrast, the histograms for both positive and negative emotional reactiv ity appear more symmetrical and bell-shaped, suggesting that these variables are approximately normally distribut ed. The distribution for positive reactivity shows a slight left skew, while the negative reactivity appears slightly more balanced. These results from the earlier normality test findings, where both PERS-S subscales showed non-sig nificant p-values, confirming normality. Overall, the histo grams reinforce the conclusion that doomscrolling scores are not normal, whereas emotional reactivity scores tend to follow a normal distribution.
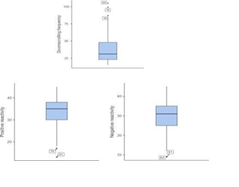
Figure 2: Box plots showing the distribution of DSS and PERS-S of positive and negative reactivity The box plots show the distribution and variability of scores for doomscrolling frequency, as well as positive and neg ative emotional reactivity. The box plot for doomscrolling frequency shows a positively skewed distribution, with the median closer to the lower end of the box and several out liers on the higher end. This indicates that while most par ticipants reported moderate to low levels of doomscrolling, a few individuals exhibited significantly higher engage ment, which skews the distribution. In contrast, the box plots for both positive and negative reactivity appear more symmetrical, with the medians centrally located within the interquartile range (IQR), suggesting relatively balanced emotional responses among participants. Both positive and negative reactivity also show fewer and more moderate outliers compared to doomscrolling, reflecting less variability and more consis tency in emotional reactivity scores. These observations are consistent with earlier statistical and graphical find ings, where doomscrolling showed greater deviation from normality and higher variability, while emotional reactivity appeared more stable and normally distributed.
|
Variable |
1 |
2 |
3 |
|
DSS |
- |
-0.153 |
0.107 |
|
PERS-S (positive) |
-0.153 |
- |
0.106 |
|
PERS-S (negative) |
0.107 |
0.106 |
- |
|
|
Note. *p<0.05 |
|
|
Table 4: Correlation Matrix between DSS and PERS-S positive and negative reactivity (N= 94)
Table 4 shows the Spearman rank-order correlation to ex amine the relationship between doomscrolling frequency (measured by the Doomscrolling Scale- DSS) and emotional reactivity (measured by the PERS-S scale) among 94 participants. The Spearman’s rank-order correlation analysis revealed that doomscrolling frequency had a weak negative correlation with positive reactivity (ρ = -0.153, p = 0.140), which was not statistically significant. This suggests that higher levels of doomscrolling were slightly associated with lower positive reactivity, but this relationship could be due to chance. Similarly, doomscroll ing frequency demonstrated a weak positive correlation with negative reactivity (ρ = 0.107, p = 0.306), which was also not statistically significant, indicating no reliable as sociation between the two variables. Additionally, positive reactivity showed a very weak positive correlation with negative reactivity (ρ = 0.106, p = 0.310), and this rela tionship was likewise not statistically significant. Overall, the results indicate that doomscrolling frequency does not have a statistically meaningful relationship with either pos itive or negative emotional reactivity in the present sample.
|
Model |
R |
R2 |
Adjusted R2 |
F |
(df) |
p |
|
1 |
0.114 |
0.0130 |
0.00227 |
1.21 |
1 |
0.274 |
|
Note. *p<0.05; Models estimated using a sample size of N=94; Predictor: Doomscrolling Scale (DSS) |
||||||
Table 5: Model (1) Summary for Regression predicting positive reactivity of PERS-S from DSS
Table 5 presents the regression model summary for pre dicting emotional reactivity, as measured by the PERS-S scale, based on participants doomscrolling frequency (DSS). The results indicate that the model is not statistical ly significant, F (1, 92) = 1.21, p = 0.274. The coefficient of determination (R²) is 0.013, which means that doomscroll ing accounts for only 1.3% of the variance in emotional reactivity. The adjusted R² value is even lower at 0.00227, indicating that after adjusting for the number of predictors, the power of the model is negligible. The correlation co efficient I is 0.114, reflecting a very weak positive linear relationship between doomscrolling and emotional reac tivity. However, given the high p-value, this relationship is not statistically significant. These findings suggest that doomscrolling does not significantly predict changes in emotional reactivity among the participants in this study. Thus, while doomscrolling is often theorized to influence emotional responses, the present model fails to provide empirical support for such a predictive relationship in this sample.
|
Model |
|
|
|
|
95% Confi- dence Interval |
||||||
|
Variable |
Std. Error |
β |
T |
P |
Lower |
Upper |
|||||
|
DSS |
0.0417 |
-0.0459 |
-1.10 |
-0.129 |
0.274 |
0.0369 |
|||||
|
Note. *p<0.05; DSS= Doomscrolling Scale |
|||||||||||
Table 6: Model (2) Summary for Regression Coefficient- Posi tive Reactivity predicting PERS-S from DSS
Table 6 presents the positive reactivity regression coeffi cient summary for the model predicting emotional reactiv ity (PERS-S scores) from doomscrolling behavior (DSS). The regression coefficient (β) for DSS was found to be 0.0417, indicating a very slight positive relationship be tween doomscrolling and emotional reactivity. However, this effect was not statistically significant, t (92) = -1.10, p = 0.274. The 95% confidence interval for the regression coefficient ranges from -0.129 to 0.0369, crossing zero, which further confirms the non- significance of the predic tor. The standard error of the regression coefficient was 0.0417, suggesting some variability around the estimate. These results imply that doomscrolling is not a significant predictor of emotional reactivity in this sample. The confi dence interval and p- value both suggest that any observed association could likely be due to chance. Therefore, the data do not support a meaningful or reliable relationship between the frequency of doomscrolling and changes in emotional reactivity.
|
Model |
R |
R2 |
Adjusted R2 |
F |
df1 |
df2 |
p |
|
1 |
0.101 |
0.0102 |
-5.41e-4 |
0.950 |
1 |
92 |
0.332 |
|
Note. *p<0.05; Models estimated using a sample size of N=94; Predictor: Doomscrolling Scale (DSS) |
|||||||
Table 7: Model (3) Summary for Regression predicting negative reactivity of PERS-S from DSS
Table 7 presents the regression analysis results predict ing negative reactivity (PERS-S) from the Doomscrolling Scale (DSS). The model yielded a very low correlation (R = 0.101) and explained only about 1.02% of the variance in negative reactivity (R² = 0.0102), with an adjusted R² value close to zero (−0.000541), indicating negligible explanato ry power. The F- test value (F = 0.950, df1 = 1, df2 = 92) was not statistically significant (p = 0.332), suggesting that doomscrolling did not significantly predict negative reactiv ity in the sample (N = 94). These results imply that within this study, doomscrolling behavior was not a meaningful predictor of negative emotional reactivity as measured by PERS-S.
|
Model |
|
|
|
|
95% Confi- dence Interval |
|
|
Vari- able |
Std. Error |
β |
t |
p |
Lower |
Upper |
|
DSS |
0.0462 |
0.0450 |
0.975 |
-0.0467 |
0.332 |
0.137 |
|
|
Note. *p<0.05; DSS= Doomscrolling Scale |
|||||
Table 8: Model (4) Summary for Regression Coefficient- Nega tive Reactivity predicting PERS-S from DSS
The regression analysis examined whether doomscrolling, as measured by the DSS, significantly predicted negative reactivity scores on the PERS-S. The results indicated that the DSS had a positive but very small regression coefficient (β = 0.045, SE = 0.0462), with a 95% confidence interval ranging from −0.0467 to 0.137. The t-value was 0.975, and the corresponding p-value was 0.332, which iswell above the 0.05 threshold for statistical significance. This suggests that doomscrolling did not significantly pre dict negative reactivity in this model. The confidence in terval further shows that the true effect could be slightly negative or positive, reinforcing the lack of a definitive re lationship between the variables in this sample.
Discussion
Participants reported moderate doomscrolling (M = 34.9, SD = 15.5) and moderate emotional responsiveness (pos itive reactivity: M = 33.8, SD = 6.23; negative reactivity: M = 31.1, SD = 6.89). Doomscrolling scores were positively skewed, while emotional reactivity scores approximated normal distribution [27].Correlational analyses indicated weak, non-significant trends: doomscrolling was slightly negatively correlated with positive reactivity (ρ = –.153, p = .140) and slightly positively correlated with negative reactivity (ρ = .107, p =.306). Regression analyses confirmed these findings, with doomscrolling explaining only 1.3% of variance in positive reactivity and 1% in negative reactivity.
These results suggest that doomscrolling does not inde pendently predict emotional desensitization, at least in the short term. While prior studies linked doomscrolling with stress and disengagement [3,11], the present findings im ply that desensitization is mediated by additional variables such as coping strategies, humor, or personality traits. For instance, neurotic individuals may disengage more quick ly [17], while humor may buffer emotional exhaustion but reinforce.
Importantly, these null results complicate simplistic narra tives that doomscrolling uniformly erodes empathy. Rath er, desensitization may emerge over longer periods, or through interactions with algorithmic exposure and social dynamics [28]. The findings underscore the necessity of longitudinal research and multimodal assessment, includ ing physiological measures such as heart rate variability.
Conclusion and Implications
This study examined the relationship between doomscroll ing and emotional desensitization in Gen Z using validat ed scales and regression analysis. Findings indicated that doomscrolling did not significantly predict emotional reac tivity, suggesting that desensitization arises from complex interactions rather than doomscrolling alone.
The implications are twofold. First, interventions should move beyond targeting doomscrolling per se to addressing broader digital habits, coping mechanisms, and platform design. Digital literacy, balanced media consumption, and emotional regulation strategies remain essential for mental health. Second, future research should adopt longitu dinal and mixed-method designs to capture the nuanced, cumulative nature of emotional desensitization.
While doomscrolling remains a salient risk factor for stress and fatigue, its direct impact on desensitization is less straightforward. By providing quantitative evidence, this study contributes empirical clarity to a discourse often dominated by anecdote, emphasizing the need for integrative approaches to protecting the emotional well-being of Gen Z.
References